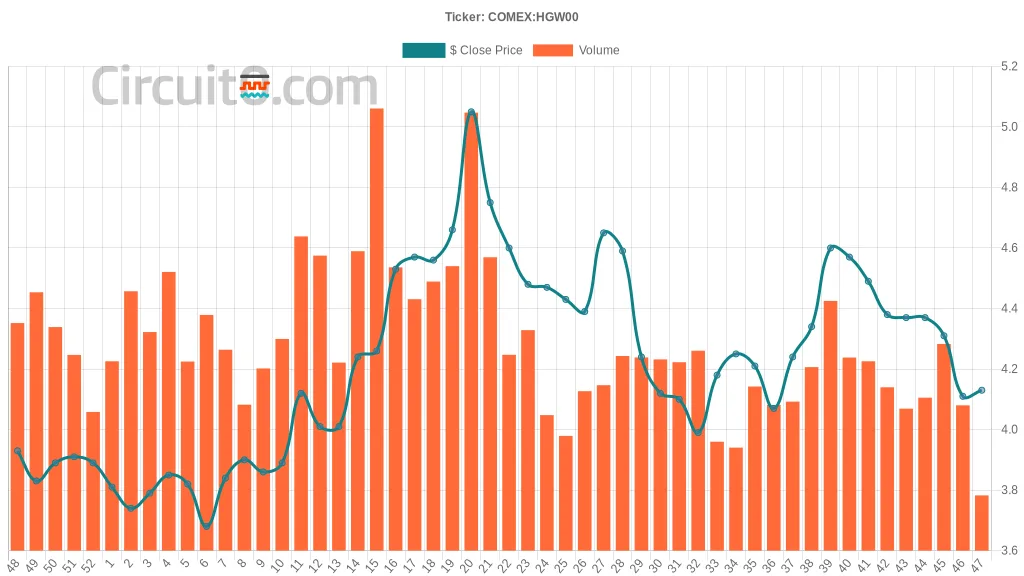
Copper has recently seen fluctuations influenced by shifting market sentiments and expectations around global demand. As of last Friday, November 22, 2024, copper closed at $4.13 after opening at $4.11 for the week. This represents a slight rise in price after reaching a low of $4.10 earlier in the week. The trading volume was notably lower compared to previous weeks, indicating some hesitation among traders.
Looking back over the months, copper prices peaked at around $4.66 in late September 2024 and have generally held above the $4 mark since then. The market was bolstered by indicators of potential fiscal stimulus from China, which is an important market for copper. However, recent weeks have demonstrated volatility, reflecting broader concerns about the outlook for electric vehicle sales and global economic trends.
Historically, since early November, prices have gradually declined from $4.37, signaling some pressure on the market as expectations about stimulus waver. The market’s remaining uncertainty revolves around supply constraints, especially as ongoing demand in the EV sector continues to develop. Regardless of recent bearish signals, the demand trend underlying copper appears resilient, mirroring optimistic forecasts impacted by ongoing technological and infrastructural developments.